| a15a |
Num |
8 |
|
Number of nights in overnigh shelter in past 6
months |
| a15b |
Num |
8 |
|
Number of nights on the street in past 6 months |
| age |
Num |
8 |
|
Age at baseline (in years) |
| anysubstatus |
Num |
8 |
ANYSUBSTATUS. |
Use of any substance post-detox |
| cesd |
Num |
8 |
|
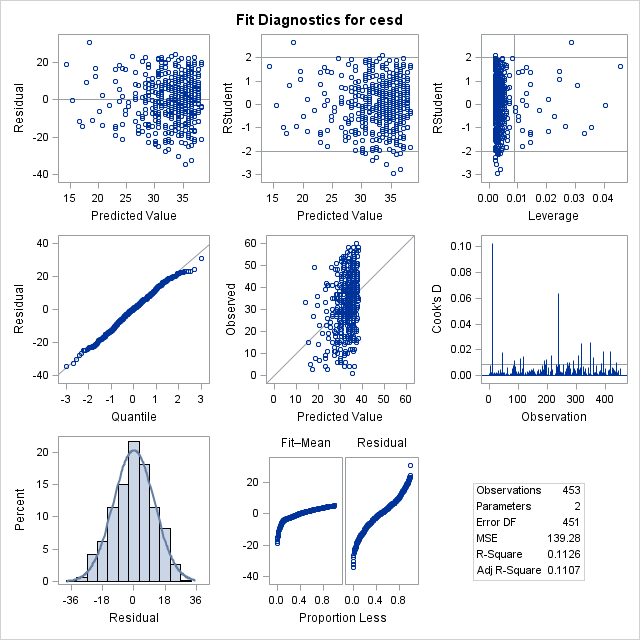
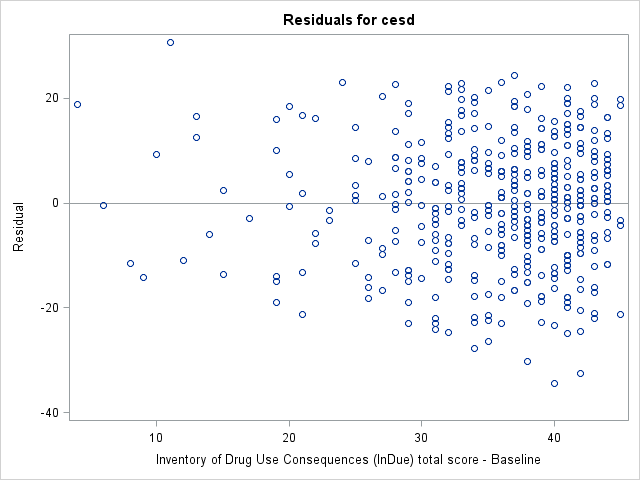
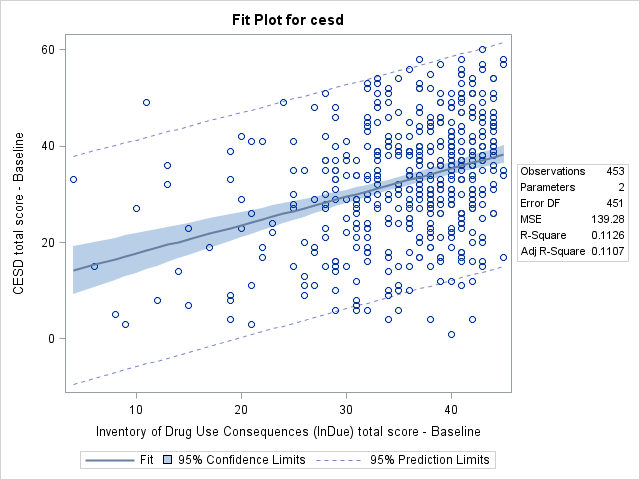
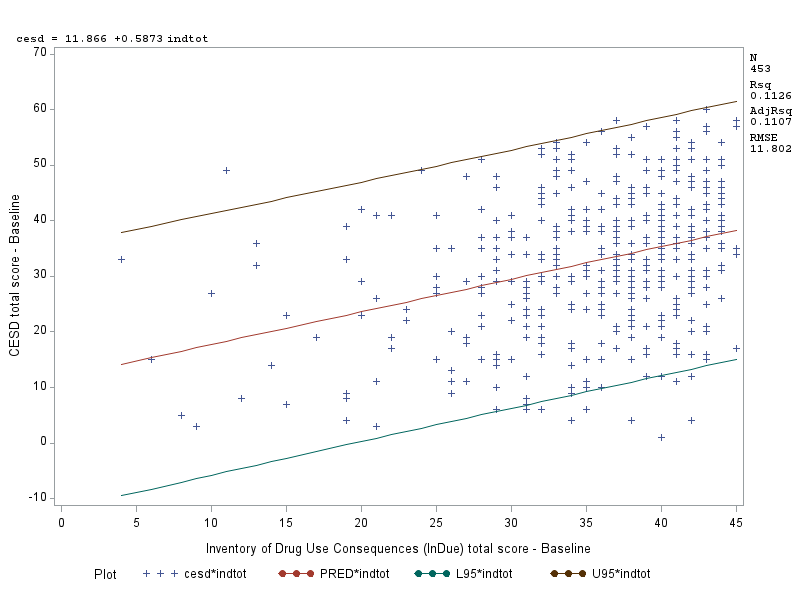
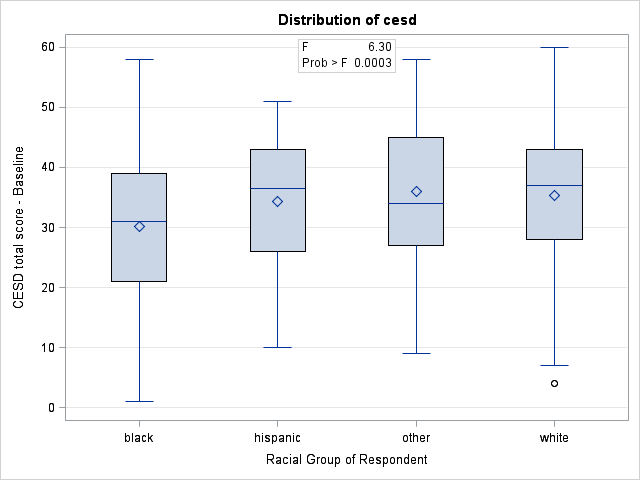
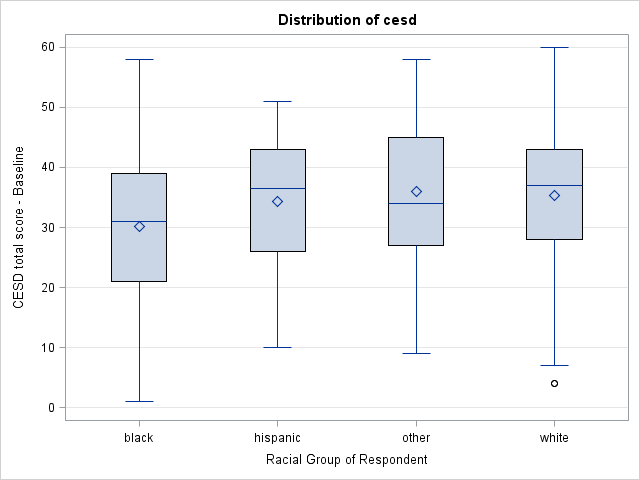
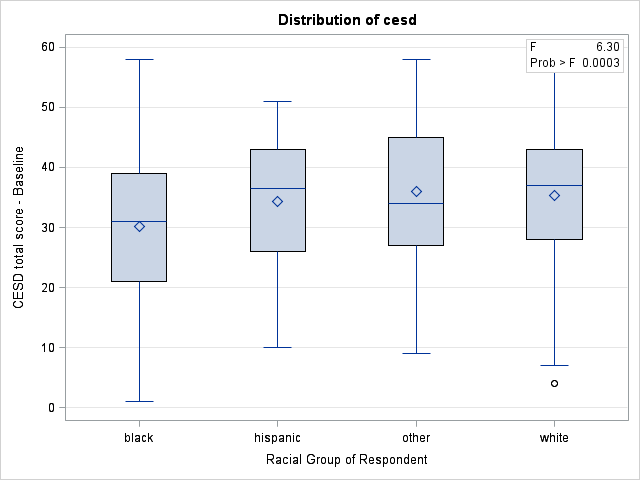
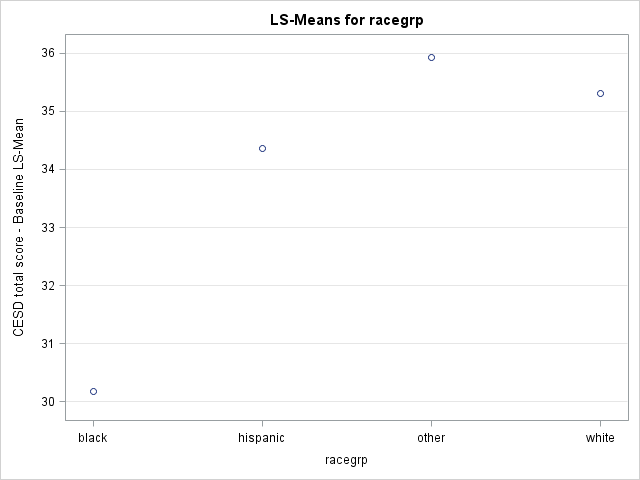
CESD total score - Baseline |
| cesd1 |
Num |
8 |
|
CESD total score - 6mo |
| cesd2 |
Num |
8 |
|
CESD total score - 12mo |
| cesd3 |
Num |
8 |
|
CESD total score - 18mo |
| cesd4 |
Num |
8 |
|
CESD total score - 24mo |
| d1 |
Num |
8 |
|
How many times hospitalized for medical problems
(lifetime) |
| daysanysub |
Num |
8 |
|
Time (in days) to first use of any substance
post-detox |
| daysdrink |
Num |
8 |
|
Time (in days) to first alcoholic drink
post-detox |
| dayslink |
Num |
8 |
|
Time (in days) to linkage to primary care |
| drinkstatus |
Num |
8 |
DRINKSTATUS. |
Use of alcohol post-detox |
| drugrisk |
Num |
8 |
|
Risk Assessment Battery (RAB) drug risk score -
Baseline |
| drugrisk1 |
Num |
8 |
|
Risk Assessment Battery (RAB) drug risk score -
6mo |
| drugrisk2 |
Num |
8 |
|
Risk Assessment Battery (RAB) drug risk score -
12mo |
| drugrisk3 |
Num |
8 |
|
Risk Assessment Battery (RAB) drug risk score -
18mo |
| drugrisk4 |
Num |
8 |
|
Risk Assessment Battery (RAB) drug risk score -
24mo |
| e2b |
Num |
8 |
|
Number of times in past 6 months entered a detox
program - Baseline |
| e2b1 |
Num |
8 |
|
Number of times in past 6 months entered a detox
program - 6mo |
| e2b2 |
Num |
8 |
|
Number of times in past 6 months entered a detox
program - 12mo |
| e2b3 |
Num |
8 |
|
Number of times in past 6 months entered a detox
program - 18mo |
| e2b4 |
Num |
8 |
|
Number of times in past 6 months entered a detox
program - 24mo |
| f1a |
Num |
8 |
F1A. |
CESD 1 - I was bothered by things that usually don't
bother me |
| f1b |
Num |
8 |
F1B. |
CESD 2 - I did not feel like eating; my appetite was
poor |
| f1c |
Num |
8 |
F1C. |
CESD 3 - I felt that I could not shake off the blues
even with help from my family or friends |
| f1d |
Num |
8 |
F1D. |
CESD 4 - I felt that I was just as good as other
people |
| f1e |
Num |
8 |
F1E. |
CESD 5 - I had trouble keeping my mind on what I was
doing |
| f1f |
Num |
8 |
F1F. |
CESD 6 - I felt depressed |
| f1g |
Num |
8 |
F1G. |
CESD 7 - I felt that everything I did was an
effort |
| f1h |
Num |
8 |
F1H. |
CESD 8 - I felt hopeful about the future |
| f1i |
Num |
8 |
F1I. |
CESD 9 - I thought my life had been a failure |
| f1j |
Num |
8 |
F1J. |
CESD 10 - I felt fearful |
| f1k |
Num |
8 |
F1K. |
CESD 11 - My sleep was restless |
| f1l |
Num |
8 |
F1L. |
CESD 12 - I was happy |
| f1m |
Num |
8 |
F1M. |
CESD 13 - I talked less than usual |
| f1n |
Num |
8 |
F1N. |
CESD 14 - I felt lonely |
| f1o |
Num |
8 |
F1O. |
CESD 15 - People were unfriendly |
| f1p |
Num |
8 |
F1P. |
CESD 16 - I enjoyed life |
| f1q |
Num |
8 |
F1Q. |
CESD 17 - I had crying spells |
| f1r |
Num |
8 |
F1R. |
CESD 18 - I felt sad |
| f1s |
Num |
8 |
F1S. |
CESD 19 - I felt that people dislike me |
| f1t |
Num |
8 |
F1T. |
CESD 20 - I could not get going |
| female |
Num |
8 |
FEMALE. |
Gender of respondent |
| g1b |
Num |
8 |
G1B. |
Experienced serious thoughts of suicide (last 30 days)
- Baseline |
| g1b1 |
Num |
8 |
|
Experienced serious thoughts of suicide (last 30 days)
- 6mo |
| g1b2 |
Num |
8 |
|
Experienced serious thoughts of suicide (last 30 days)
- 12mo |
| g1b3 |
Num |
8 |
|
Experienced serious thoughts of suicide (last 30 days)
- 18mo |
| g1b4 |
Num |
8 |
|
Experienced serious thoughts of suicide (last 30 days)
- 24mo |
| homeless |
Num |
8 |
HOMELESS. |
One or more nights on the street or shelter in past 6
months |
| i1 |
Num |
8 |
|
Average number of drinks (standard units) consumed per
day (in past 30 days) - Baseline |
| i2 |
Num |
8 |
|
Maximum number of drinks (standard units) consumed per
day (in past 30 days) |
| i11 |
Num |
8 |
|
Average number of drinks (standard units) consumed per
day (in past 30 days) - 6mo |
| i12 |
Num |
8 |
|
Average number of drinks (standard units) consumed per
day (in past 30 days) - 12mo |
| i13 |
Num |
8 |
|
Average number of drinks (standard units) consumed per
day (in past 30 days) - 18mo |
| i14 |
Num |
8 |
|
Average number of drinks (standard units) consumed per
day (in past 30 days) - 24mo |
| id |
Num |
8 |
|
Subject ID |
| indtot |
Num |
8 |
|
Inventory of Drug Use Consequences (InDue) total score
- Baseline |
| indtot1 |
Num |
8 |
|
Inventory of Drug Use Consequences (InDue) total score
- 6mo |
| indtot2 |
Num |
8 |
|
Inventory of Drug Use Consequences (InDue) total score
- 12mo |
| indtot3 |
Num |
8 |
|
Inventory of Drug Use Consequences (InDue) total score
- 18mo |
| indtot4 |
Num |
8 |
|
Inventory of Drug Use Consequences (InDue) total score
- 24mo |
| linkstatus |
Num |
8 |
LINKSTATUS. |
Post-detox linkage to primary care |
| mcs |
Num |
8 |
|
SF36 Mental Composite Score - Baseline |
| mcs1 |
Num |
8 |
|
SF36 Mental Composite Score - 6mo |
| mcs2 |
Num |
8 |
|
SF36 Mental Composite Score - 12mo |
| mcs3 |
Num |
8 |
|
SF36 Mental Composite Score - 18mo |
| mcs4 |
Num |
8 |
|
SF36 Mental Composite Score - 24mo |
| pcrec1 |
Num |
8 |
|
Number of primary care visits in past 6 months -
6mo |
| pcrec2 |
Num |
8 |
|
Number of primary care visits in past 6 months -
12mo |
| pcrec3 |
Num |
8 |
|
Number of primary care visits in past 6 months -
18mo |
| pcrec4 |
Num |
8 |
|
Number of primary care visits in past 6 months -
24mo |
| pcs |
Num |
8 |
|
SF36 Physical Composite Score - Baseline |
| pcs1 |
Num |
8 |
|
SF36 Physical Composite Score - 6mo |
| pcs2 |
Num |
8 |
|
SF36 Physical Composite Score - 12mo |
| pcs3 |
Num |
8 |
|
SF36 Physical Composite Score - 18mo |
| pcs4 |
Num |
8 |
|
SF36 Physical Composite Score - 24mo |
| pss_fr |
Num |
8 |
|
Perceived Social Support - friends |
| racegrp |
Char |
8 |
|
Racial Group of Respondent |
| satreat |
Num |
8 |
SATREAT. |
Any BSAS substance abuse treatment at baseline |
| sexrisk |
Num |
8 |
|
Risk Assessment Battery (RAB) sex risk score -
Baseline |
| sexrisk1 |
Num |
8 |
|
Risk Assessment Battery (RAB) sex risk score -
6mo |
| sexrisk2 |
Num |
8 |
|
Risk Assessment Battery (RAB) sex risk score -
12mo |
| sexrisk3 |
Num |
8 |
|
Risk Assessment Battery (RAB) sex risk score -
18mo |
| sexrisk4 |
Num |
8 |
|
Risk Assessment Battery (RAB) sex risk score -
24mo |
| substance |
Char |
7 |
|
Primary substance of abuse |
| treat |
Num |
8 |
TREAT. |
Randomization
Group |