| The SAS System |
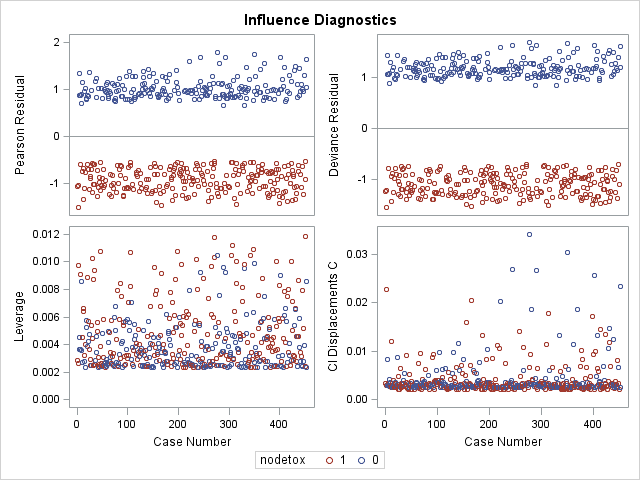
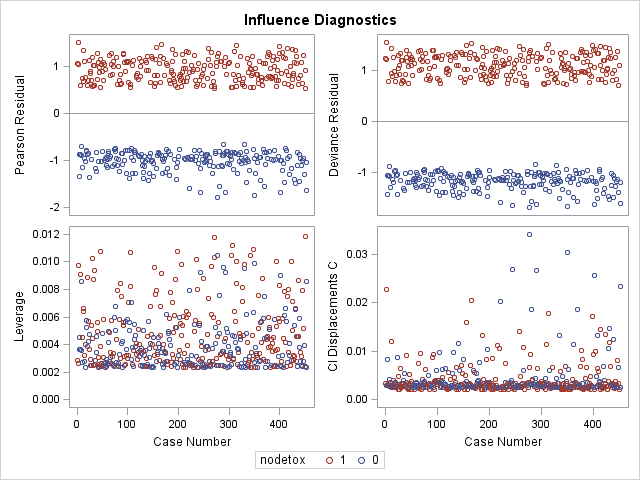
The LOGISTIC Procedure
| Model Information | |
|---|---|
| Data Set | WORK.HELP2 |
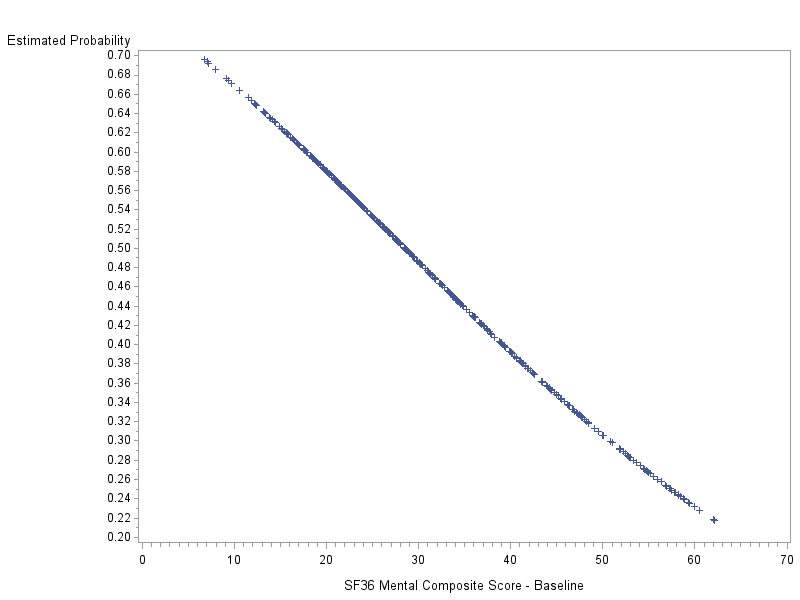
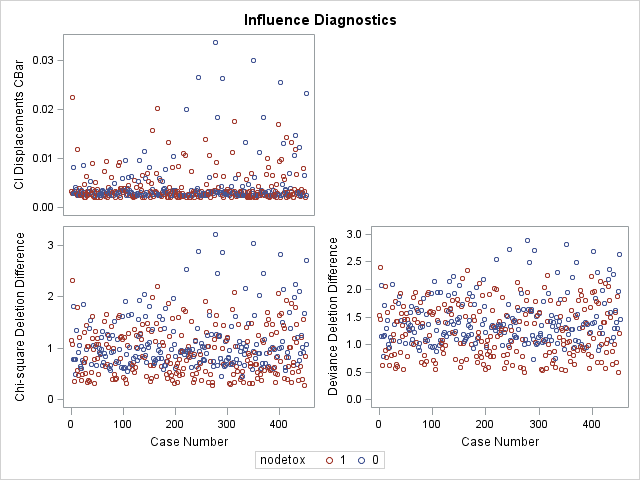
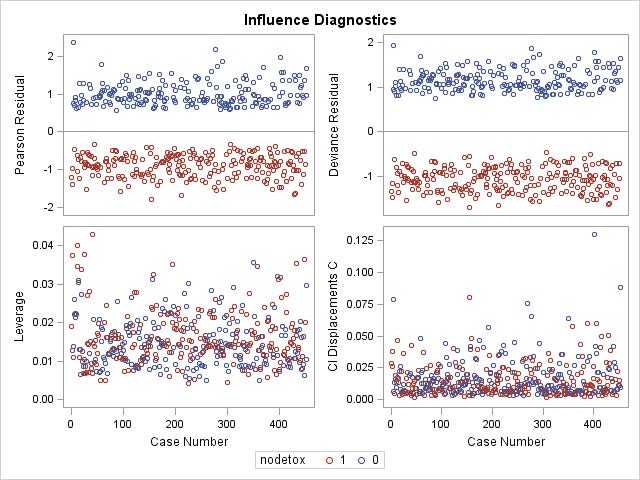
| Response Variable | nodetox |
| Number of Response Levels | 2 |
| Model | binary logit |
| Optimization Technique | Fisher's scoring |
| Number of Observations Read | 453 |
|---|---|
| Number of Observations Used | 453 |
| Response Profile | ||
|---|---|---|
| Ordered Value |
nodetox | Total Frequency |
| 1 | 0 | 214 |
| 2 | 1 | 239 |
| Probability modeled is nodetox=0. |
| Model Convergence Status |
|---|
| Convergence criterion (GCONV=1E-8) satisfied. |
| Model Fit Statistics | ||
|---|---|---|
| Criterion | Intercept Only | Intercept and Covariates |
| AIC | 628.611 | 605.646 |
| SC | 632.727 | 613.878 |
| -2 Log L | 626.611 | 601.646 |
| Testing Global Null Hypothesis: BETA=0 | |||
|---|---|---|---|
| Test | Chi-Square | DF | Pr > ChiSq |
| Likelihood Ratio | 24.9650 | 1 | <.0001 |
| Score | 24.3243 | 1 | <.0001 |
| Wald | 23.2743 | 1 | <.0001 |
| Analysis of Maximum Likelihood Estimates | |||||
|---|---|---|---|---|---|
| Parameter | DF | Estimate | Standard Error |
Wald Chi-Square |
Pr > ChiSq |
| Intercept | 1 | 1.0846 | 0.2632 | 16.9808 | <.0001 |
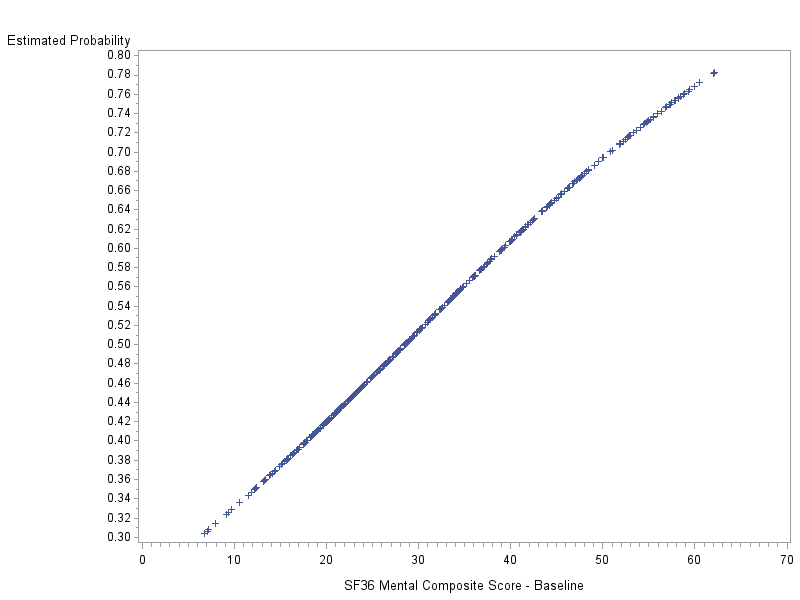
| mcs | 1 | -0.0381 | 0.00789 | 23.2743 | <.0001 |
| Odds Ratio Estimates | |||
|---|---|---|---|
| Effect | Point Estimate | 95% Wald Confidence Limits | |
| mcs | 0.963 | 0.948 | 0.978 |
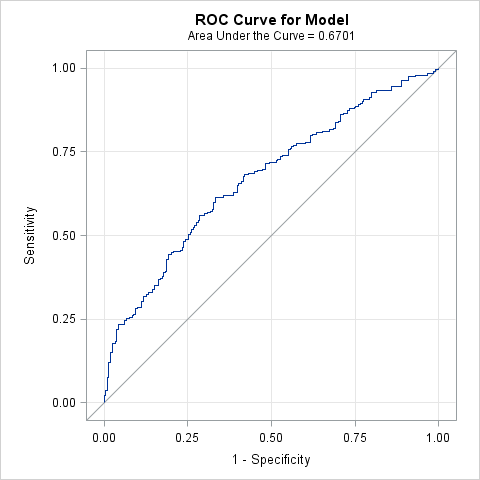
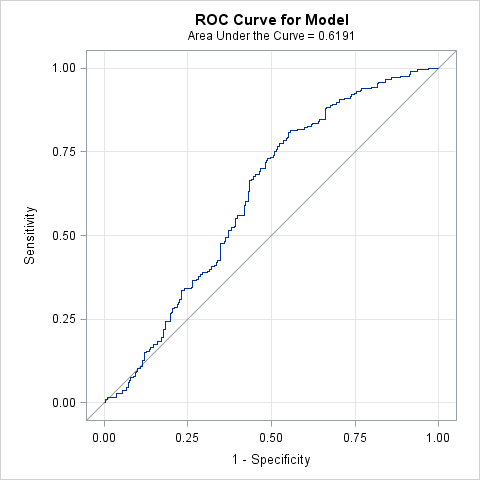
| Association of Predicted
Probabilities and Observed Responses | |||
|---|---|---|---|
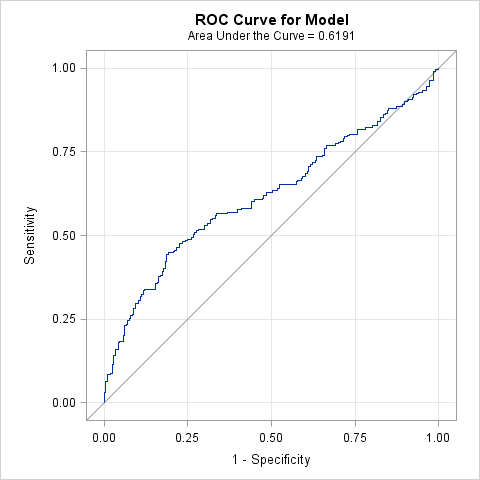
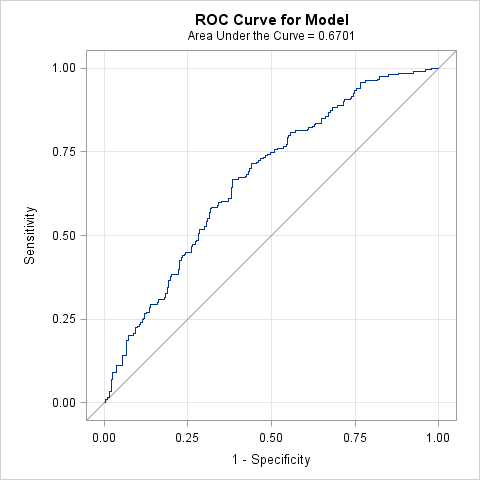
| Percent Concordant | 61.9 | Somers' D | 0.238 |
| Percent Discordant | 38.1 | Gamma | 0.238 |
| Percent Tied | 0.0 | Tau-a | 0.119 |
| Pairs | 51146 | c | 0.619 |
| Classification Table | |||||||||
|---|---|---|---|---|---|---|---|---|---|
| Prob Level |
Correct | Incorrect | Percentages | ||||||
| Event | Non- Event |
Event | Non- Event |
Correct | Sensi- tivity |
Speci- ficity |
False POS |
False NEG | |
| 0.200 | 214 | 0 | 239 | 0 | 47.2 | 100.0 | 0.0 | 52.8 | . |
| 0.300 | 205 | 39 | 200 | 9 | 53.9 | 95.8 | 16.3 | 49.4 | 18.8 |
| 0.400 | 176 | 91 | 148 | 38 | 58.9 | 82.2 | 38.1 | 45.7 | 29.5 |
| 0.500 | 120 | 138 | 101 | 94 | 57.0 | 56.1 | 57.7 | 45.7 | 40.5 |
| 0.600 | 27 | 210 | 29 | 187 | 52.3 | 12.6 | 87.9 | 51.8 | 47.1 |
| 0.700 | 0 | 238 | 1 | 214 | 52.5 | 0.0 | 99.6 | 100.0 | 47.3 |
| 0.800 | 0 | 239 | 0 | 214 | 52.8 | 0.0 | 100.0 | . | 47.2 |