| LIBRARY |
| V9 |
| C:\MyGithub\N736Fall2017_HELPdataset |
| C:\MyGithub\N736Fall2017_HELPdataset |
| FORMATS |
CATALOG |
33792 |
11/05/2017 19:28:41 |
| HELP |
DATA |
175104 |
09/17/2017 06:30:26 |
| HELPMKH |
DATA |
361472 |
11/05/2017
13:53:38 |
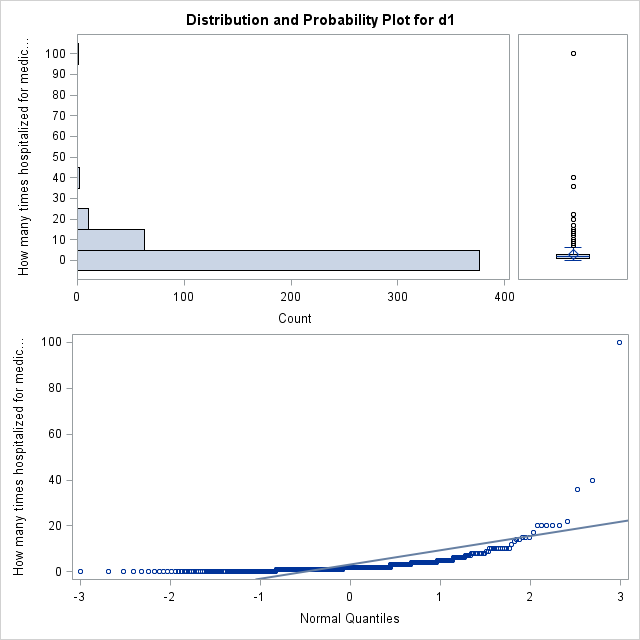
The UNIVARIATE Procedure
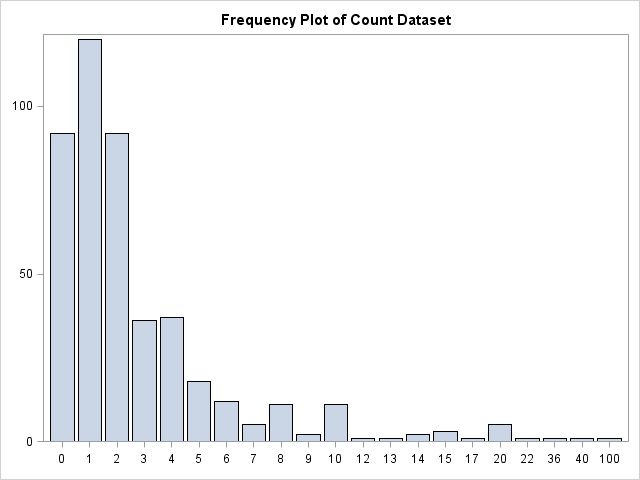
Variable: d1 (How many times hospitalized for medical
problems (lifetime))
| 453 |
453 |
| 3.05960265 |
1386 |
| 6.18758941 |
38.2862627 |
| 9.78164035 |
137.817594 |
| 21546 |
17305.3907 |
| 202.235065 |
0.29071831 |
| 3.059603 |
6.18759 |
| 2.000000 |
38.28626 |
| 1.000000 |
100.00000 |
| |
2.00000 |
| 10.52429 |
<.0001 |
| 180.5 |
<.0001 |
| 32670.5 |
<.0001 |
| 100 |
| 20 |
| 10 |
| 7 |
| 3 |
| 2 |
| 1 |
| 0 |
| 0 |
| 0 |
| 0 |
| 0 |
451 |
20 |
275 |
| 0 |
450 |
22 |
2 |
| 0 |
448 |
36 |
286 |
| 0 |
442 |
40 |
175 |
| 0 |
437 |
100 |
429 |
The UNIVARIATE Procedure
The UNIVARIATE Procedure
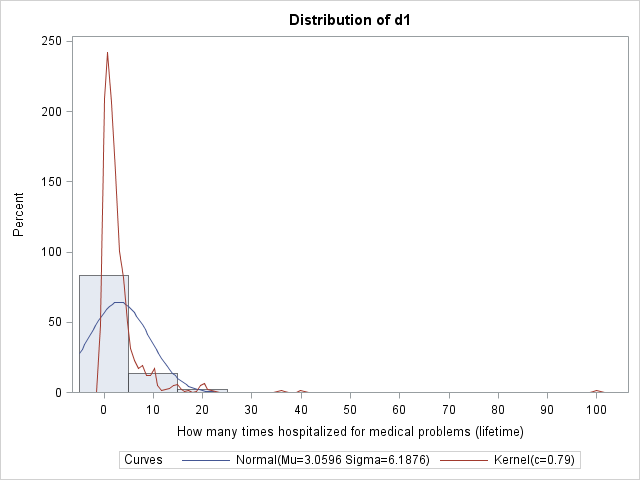
Fitted Normal Distribution for d1 (How many times
hospitalized for medical problems (lifetime))
| Mu |
3.059603 |
| Sigma |
6.187589 |
| 0.3104857 |
<0.010 |
| 12.7755204 |
<0.005 |
| 66.0613233 |
<0.005 |
| 0.0000 |
-11.33488 |
| 0.0000 |
-7.11808 |
| 0.0000 |
-4.87011 |
| 1.0000 |
-1.11386 |
| 2.0000 |
3.05960 |
| 3.0000 |
7.23307 |
| 7.0000 |
10.98932 |
| 10.0000 |
13.23728 |
| 20.0000 |
17.45409 |
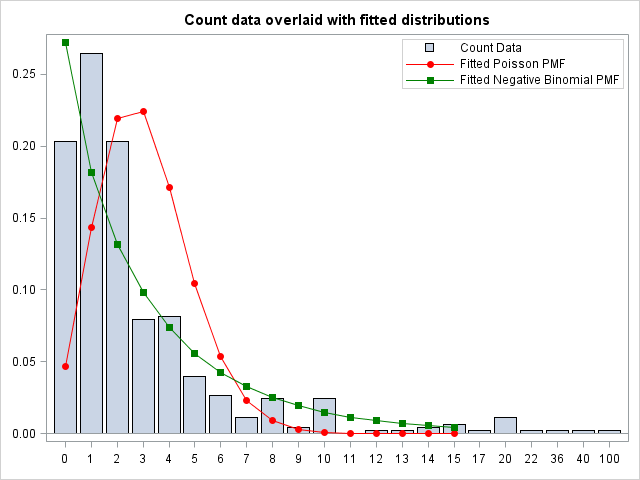
The GENMOD Procedure
| WORK.HELPMKH |
|
| Poisson |
|
| Log |
|
| d1 |
How many times hospitalized for medical problems
(lifetime) |
| 451 |
1899.7021 |
4.2122 |
| 451 |
1899.7021 |
4.2122 |
| 451 |
3178.6758 |
7.0481 |
| 451 |
3178.6758 |
7.0481 |
| |
345.0367 |
|
| |
-1457.0324 |
|
| |
2918.0647 |
|
| |
2918.0914 |
|
| |
2926.2965 |
|
| 1 |
3.2060 |
0.1059 |
2.9984 |
3.4135 |
916.66 |
<.0001 |
| 1 |
-0.0461 |
0.0024 |
-0.0508 |
-0.0414 |
365.06 |
<.0001 |
| 0 |
1.0000 |
0.0000 |
1.0000 |
1.0000 |
|
|
| Note: |
The scale parameter was held
fixed. |
The GENMOD Procedure
| WORK.HELPMKH |
|
| Negative Binomial |
|
| Log |
|
| d1 |
How many times hospitalized for medical problems
(lifetime) |
| 451 |
475.6527 |
1.0547 |
| 451 |
475.6527 |
1.0547 |
| 451 |
730.0271 |
1.6187 |
| 451 |
730.0271 |
1.6187 |
| |
817.4048 |
|
| |
-984.6643 |
|
| |
1975.3286 |
|
| |
1975.3820 |
|
| |
1987.6762 |
|
| 1 |
3.1266 |
0.2324 |
2.6710 |
3.5821 |
180.96 |
<.0001 |
| 1 |
-0.0444 |
0.0049 |
-0.0539 |
-0.0348 |
83.30 |
<.0001 |
| 1 |
0.9105 |
0.0855 |
0.7575 |
1.0944 |
|
|
| Note: |
The negative binomial dispersion parameter was
estimated by maximum likelihood. |
The GENMOD Procedure
| WORK.HELPMKH |
|
| Poisson |
|
| Log |
|
| d1 |
How many times hospitalized for medical problems
(lifetime) |
| 452 |
2261.8893 |
5.0042 |
| 452 |
2261.8893 |
5.0042 |
| 452 |
5656.0908 |
12.5135 |
| 452 |
5656.0908 |
12.5135 |
| |
163.9431 |
|
| |
-1638.1260 |
|
| |
3278.2519 |
|
| |
3278.2608 |
|
| |
3282.3678 |
|
| 1 |
1.1183 |
0.0269 |
1.0656 |
1.1709 |
1733.28 |
<.0001 |
| 0 |
1.0000 |
0.0000 |
1.0000 |
1.0000 |
|
|
| Note: |
The scale parameter was held
fixed. |
The GENMOD Procedure
| WORK.HELPMKH |
|
| Negative Binomial |
|
| Log |
|
| d1 |
How many times hospitalized for medical problems
(lifetime) |
| 452 |
481.8317 |
1.0660 |
| 452 |
481.8317 |
1.0660 |
| 452 |
1235.3462 |
2.7331 |
| 452 |
1235.3462 |
2.7331 |
| |
777.0562 |
|
| |
-1025.0128 |
|
| |
2054.0257 |
|
| |
2054.0523 |
|
| |
2062.2574 |
|
| 1 |
1.1183 |
0.0575 |
1.0056 |
1.2309 |
378.57 |
<.0001 |
| 1 |
1.1696 |
0.1010 |
0.9876 |
1.3852 |
|
|
| Note: |
The negative binomial dispersion parameter was
estimated by maximum likelihood. |