The SAS System

Directory
Libref LIBRARY
Engine V9
Physical Name C:\MyGithub\N736Fall2017_HELPdataset
Filename C:\MyGithub\N736Fall2017_HELPdataset

# Name Member Type File Size Last Modified
1 FORMATS CATALOG 33792 11/12/2017 12:18:02
2 HELP DATA 175104 09/17/2017 06:30:26
3 HELPMKH DATA 361472 11/12/2017 11:54:59


The SAS System

The CORR Procedure

5 Variables: pcs pcs1 pcs2 pcs3 pcs4

Simple Statistics
Variable N Mean Std Dev Sum Minimum Maximum Label
pcs 453 48.04854 10.78460 21766 14.07429 74.80633 SF36 Physical Composite Score - Baseline
pcs1 246 50.15782 10.34906 12339 19.69587 71.44481 SF36 Physical Composite Score - 6mo
pcs2 211 50.02478 10.40017 10555 14.44359 68.93177 SF36 Physical Composite Score - 12mo
pcs3 248 49.09576 11.13641 12176 18.51821 71.29130 SF36 Physical Composite Score - 18mo
pcs4 266 49.76448 10.09496 13237 15.41477 69.72089 SF36 Physical Composite Score - 24mo

Pearson Correlation Coefficients
Prob > |r| under H0: Rho=0
Number of Observations
  pcs pcs1 pcs2 pcs3 pcs4
pcs
SF36 Physical Composite Score - Baseline
1.00000
 
453
0.56127
<.0001
246
0.55722
<.0001
211
0.48781
<.0001
248
0.49498
<.0001
266
pcs1
SF36 Physical Composite Score - 6mo
0.56127
<.0001
246
1.00000
 
246
0.59743
<.0001
151
0.51665
<.0001
157
0.38004
<.0001
165
pcs2
SF36 Physical Composite Score - 12mo
0.55722
<.0001
211
0.59743
<.0001
151
1.00000
 
211
0.75213
<.0001
155
0.54287
<.0001
155
pcs3
SF36 Physical Composite Score - 18mo
0.48781
<.0001
248
0.51665
<.0001
157
0.75213
<.0001
155
1.00000
 
248
0.51349
<.0001
197
pcs4
SF36 Physical Composite Score - 24mo
0.49498
<.0001
266
0.38004
<.0001
165
0.54287
<.0001
155
0.51349
<.0001
197
1.00000
 
266


The SAS System

The GLM Procedure

Number of Observations Read 453
Number of Observations Used 98


The SAS System

The GLM Procedure
 
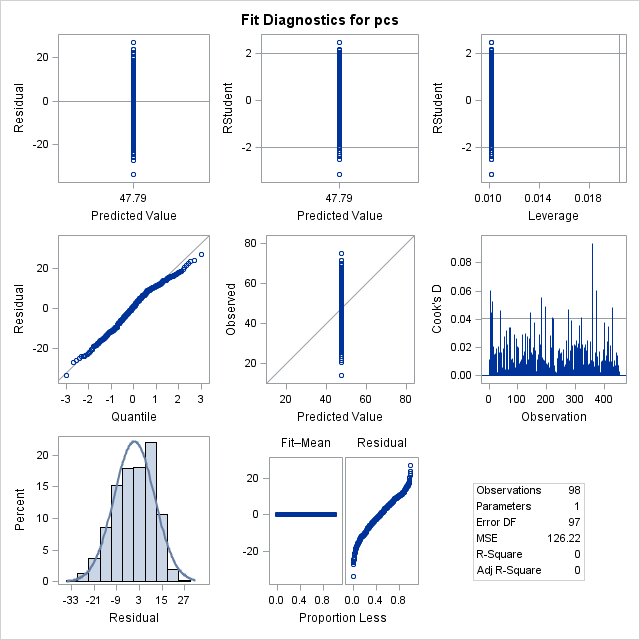
Dependent Variable: pcs SF36 Physical Composite Score - Baseline

Source DF Sum of Squares Mean Square F Value Pr > F
Model 1 223856.6577 223856.6577 1773.49 <.0001
Error 97 12243.7018 126.2237    
Uncorrected Total 98 236100.3595      

R-Square Coeff Var Root MSE pcs Mean
0.000000 23.50707 11.23493 47.79384

Source DF Type I SS Mean Square F Value Pr > F
Intercept 1 223856.6577 223856.6577 1773.49 <.0001

Source DF Type III SS Mean Square F Value Pr > F
Intercept 1 223856.6577 223856.6577 1773.49 <.0001

Parameter Estimate Standard Error t Value Pr > |t|
Intercept 47.79384488 1.13489966 42.11 <.0001

Panel of Fit Diagnostics for pcs, which displays scatter plots of residuals, absolute residuals, studentized residuals, and observed responses by predicted values, studentized residuals by leverage, Cook's D by observation, a Q-Q plot of residuals, a residual histogram, and a residual-fit spread plot.


The SAS System

The GLM Procedure
 
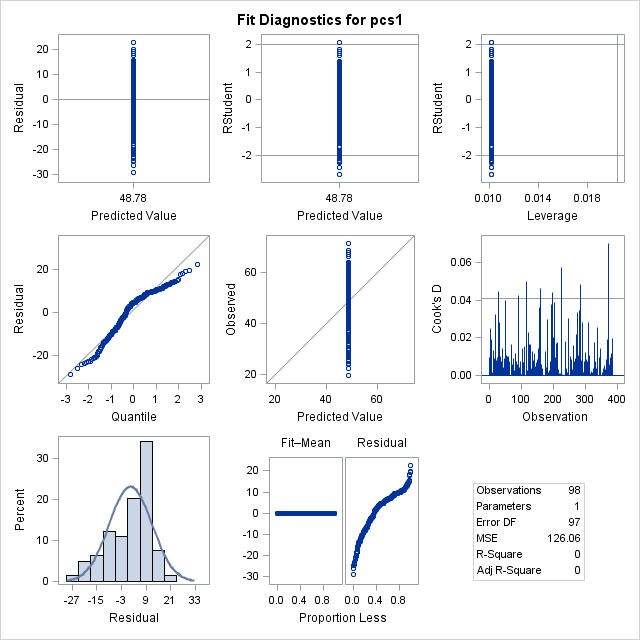
Dependent Variable: pcs1 SF36 Physical Composite Score - 6mo

Source DF Sum of Squares Mean Square F Value Pr > F
Model 1 233188.3677 233188.3677 1849.87 <.0001
Error 97 12227.5046 126.0567    
Uncorrected Total 98 245415.8724      

R-Square Coeff Var Root MSE pcs1 Mean
0.000000 23.01668 11.22750 48.77984

Source DF Type I SS Mean Square F Value Pr > F
Intercept 1 233188.3677 233188.3677 1849.87 <.0001

Source DF Type III SS Mean Square F Value Pr > F
Intercept 1 233188.3677 233188.3677 1849.87 <.0001

Parameter Estimate Standard Error t Value Pr > |t|
Intercept 48.77984358 1.13414874 43.01 <.0001

Panel of Fit Diagnostics for pcs1, which displays scatter plots of residuals, absolute residuals, studentized residuals, and observed responses by predicted values, studentized residuals by leverage, Cook's D by observation, a Q-Q plot of residuals, a residual histogram, and a residual-fit spread plot.


The SAS System

The GLM Procedure
 
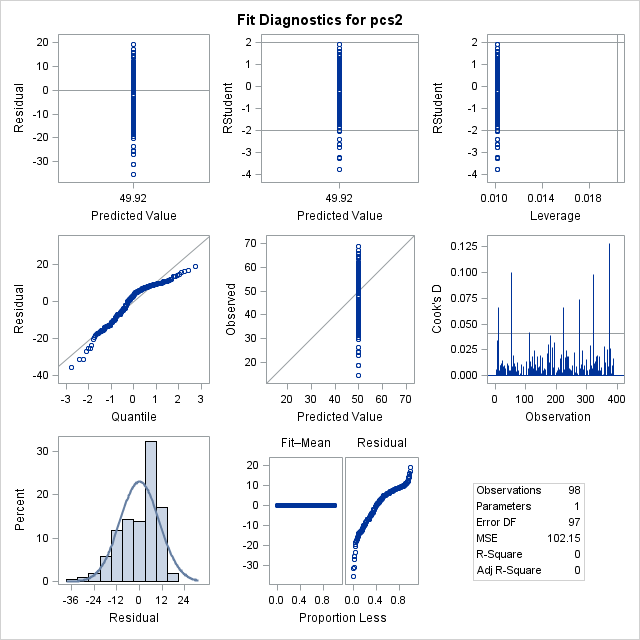
Dependent Variable: pcs2 SF36 Physical Composite Score - 12mo

Source DF Sum of Squares Mean Square F Value Pr > F
Model 1 244213.8344 244213.8344 2390.68 <.0001
Error 97 9908.7743 102.1523    
Uncorrected Total 98 254122.6087      

R-Square Coeff Var Root MSE pcs2 Mean
0.000000 20.24660 10.10704 49.91971

Source DF Type I SS Mean Square F Value Pr > F
Intercept 1 244213.8344 244213.8344 2390.68 <.0001

Source DF Type III SS Mean Square F Value Pr > F
Intercept 1 244213.8344 244213.8344 2390.68 <.0001

Parameter Estimate Standard Error t Value Pr > |t|
Intercept 49.91971457 1.02096549 48.89 <.0001

Panel of Fit Diagnostics for pcs2, which displays scatter plots of residuals, absolute residuals, studentized residuals, and observed responses by predicted values, studentized residuals by leverage, Cook's D by observation, a Q-Q plot of residuals, a residual histogram, and a residual-fit spread plot.


The SAS System

The GLM Procedure
 
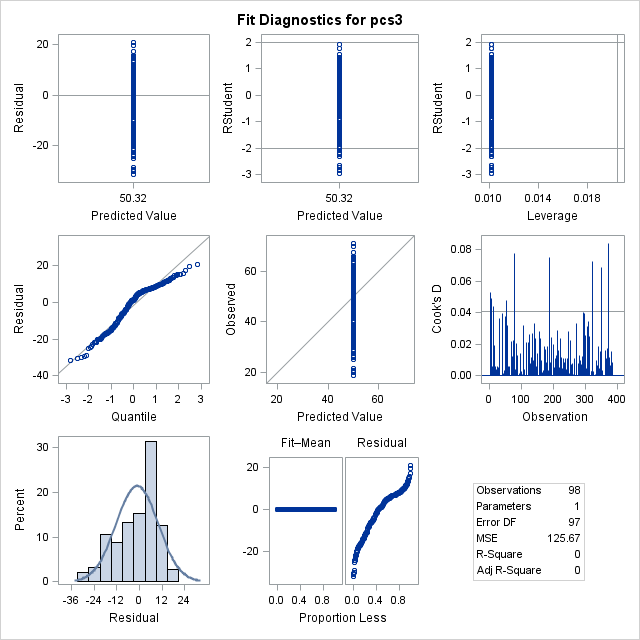
Dependent Variable: pcs3 SF36 Physical Composite Score - 18mo

Source DF Sum of Squares Mean Square F Value Pr > F
Model 1 248154.1737 248154.1737 1974.72 <.0001
Error 97 12189.5563 125.6655    
Uncorrected Total 98 260343.7300      

R-Square Coeff Var Root MSE pcs3 Mean
0.000000 22.27719 11.21006 50.32083

Source DF Type I SS Mean Square F Value Pr > F
Intercept 1 248154.1737 248154.1737 1974.72 <.0001

Source DF Type III SS Mean Square F Value Pr > F
Intercept 1 248154.1737 248154.1737 1974.72 <.0001

Parameter Estimate Standard Error t Value Pr > |t|
Intercept 50.32082517 1.13238744 44.44 <.0001

Panel of Fit Diagnostics for pcs3, which displays scatter plots of residuals, absolute residuals, studentized residuals, and observed responses by predicted values, studentized residuals by leverage, Cook's D by observation, a Q-Q plot of residuals, a residual histogram, and a residual-fit spread plot.


The SAS System

The GLM Procedure
 
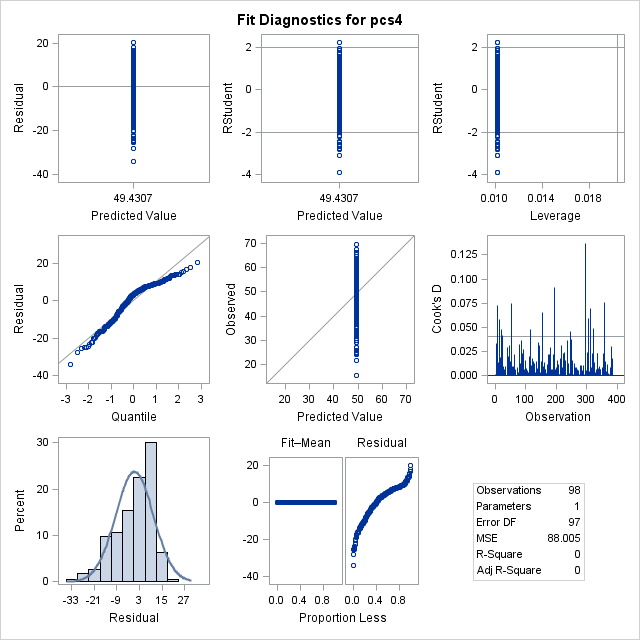
Dependent Variable: pcs4 SF36 Physical Composite Score - 24mo

Source DF Sum of Squares Mean Square F Value Pr > F
Model 1 239452.6568 239452.6568 2720.91 <.0001
Error 97 8536.4556 88.0047    
Uncorrected Total 98 247989.1124      

R-Square Coeff Var Root MSE pcs4 Mean
0.000000 18.97825 9.381082 49.43070

Source DF Type I SS Mean Square F Value Pr > F
Intercept 1 239452.6568 239452.6568 2720.91 <.0001

Source DF Type III SS Mean Square F Value Pr > F
Intercept 1 239452.6568 239452.6568 2720.91 <.0001

Parameter Estimate Standard Error t Value Pr > |t|
Intercept 49.43070359 0.94763237 52.16 <.0001

Panel of Fit Diagnostics for pcs4, which displays scatter plots of residuals, absolute residuals, studentized residuals, and observed responses by predicted values, studentized residuals by leverage, Cook's D by observation, a Q-Q plot of residuals, a residual histogram, and a residual-fit spread plot.


The SAS System

The GLM Procedure
Repeated Measures Analysis of Variance

Repeated Measures Level Information
Dependent Variable pcs pcs1 pcs2 pcs3 pcs4
Level of time 1 2 3 4 5

Partial Correlation Coefficients from the Error SSCP Matrix / Prob > |r|
DF = 97 pcs pcs1 pcs2 pcs3 pcs4
pcs
1.000000
 
0.586878
<.0001
0.600132
<.0001
0.591866
<.0001
0.495358
<.0001
pcs1
0.586878
<.0001
1.000000
 
0.626314
<.0001
0.657078
<.0001
0.456213
<.0001
pcs2
0.600132
<.0001
0.626314
<.0001
1.000000
 
0.749012
<.0001
0.590039
<.0001
pcs3
0.591866
<.0001
0.657078
<.0001
0.749012
<.0001
1.000000
 
0.591226
<.0001
pcs4
0.495358
<.0001
0.456213
<.0001
0.590039
<.0001
0.591226
<.0001
1.000000
 

E = Error SSCP Matrix
time_N represents the contrast between the nth level of time and the last
  time_1 time_2 time_3 time_4
time_1 10651.7 5992.1 4655.8 4671.9
time_2 5992.1 11442.0 5342.9 5866.5
time_3 4655.8 5342.9 7592.0 5310.6
time_4 4671.9 5866.5 5310.6 8664.1

Partial Correlation Coefficients from the Error SSCP Matrix of the Variables Defined by the Specified Transformation / Prob > |r|
DF = 97 time_1 time_2 time_3 time_4
time_1
1.000000
 
0.542769
<.0001
0.517732
<.0001
0.486316
<.0001
time_2
0.542769
<.0001
1.000000
 
0.573251
<.0001
0.589202
<.0001
time_3
0.517732
<.0001
0.573251
<.0001
1.000000
 
0.654798
<.0001
time_4
0.486316
<.0001
0.589202
<.0001
0.654798
<.0001
1.000000
 

Sphericity Tests
Variables DF Mauchly's Criterion Chi-Square Pr > ChiSq
Transformed Variates 9 0.2026835 152.29548 <.0001
Orthogonal Components 9 0.845719 15.988796 0.0671

MANOVA Test Criteria and Exact F Statistics for the Hypothesis of no time Effect
H = Type III SSCP Matrix for time
E = Error SSCP Matrix

S=1 M=1 N=46
Statistic Value F Value Num DF Den DF Pr > F
Wilks' Lambda 0.93150849 1.73 4 94 0.1503
Pillai's Trace 0.06849151 1.73 4 94 0.1503
Hotelling-Lawley Trace 0.07352752 1.73 4 94 0.1503
Roy's Greatest Root 0.07352752 1.73 4 94 0.1503


The SAS System

The GLM Procedure
Repeated Measures Analysis of Variance
Univariate Tests of Hypotheses for Within Subject Effects

Source DF Type III SS Mean Square F Value Pr > F Adj Pr > F
G - G H - F
time 4 388.98822 97.24706 2.10 0.0798 0.0849 0.0818
Error(time) 388 17943.97763 46.24737        

Greenhouse-Geisser Epsilon 0.9306
Huynh-Feldt Epsilon 0.9724


The SAS System

The GLM Procedure
Repeated Measures Analysis of Variance
 
Means of Within Subjects Effects

Level of
time
N Mean Std Dev
1 98 47.79384488 11.23493347
2 98 48.77984358 11.22749967
3 98 49.91971457 10.10704270
4 98 50.32082517 11.21006373
5 98 49.43070359 9.38108186