Emory NRSG 736: Quantitative Analysis of Clinical Research Data
Week 01: Welcome and Introductions
Load some R packages
ggplot(data = penguins,
       aes(x = bill_length_mm,
           y = bill_depth_mm,
           color = species)) +
  geom_point()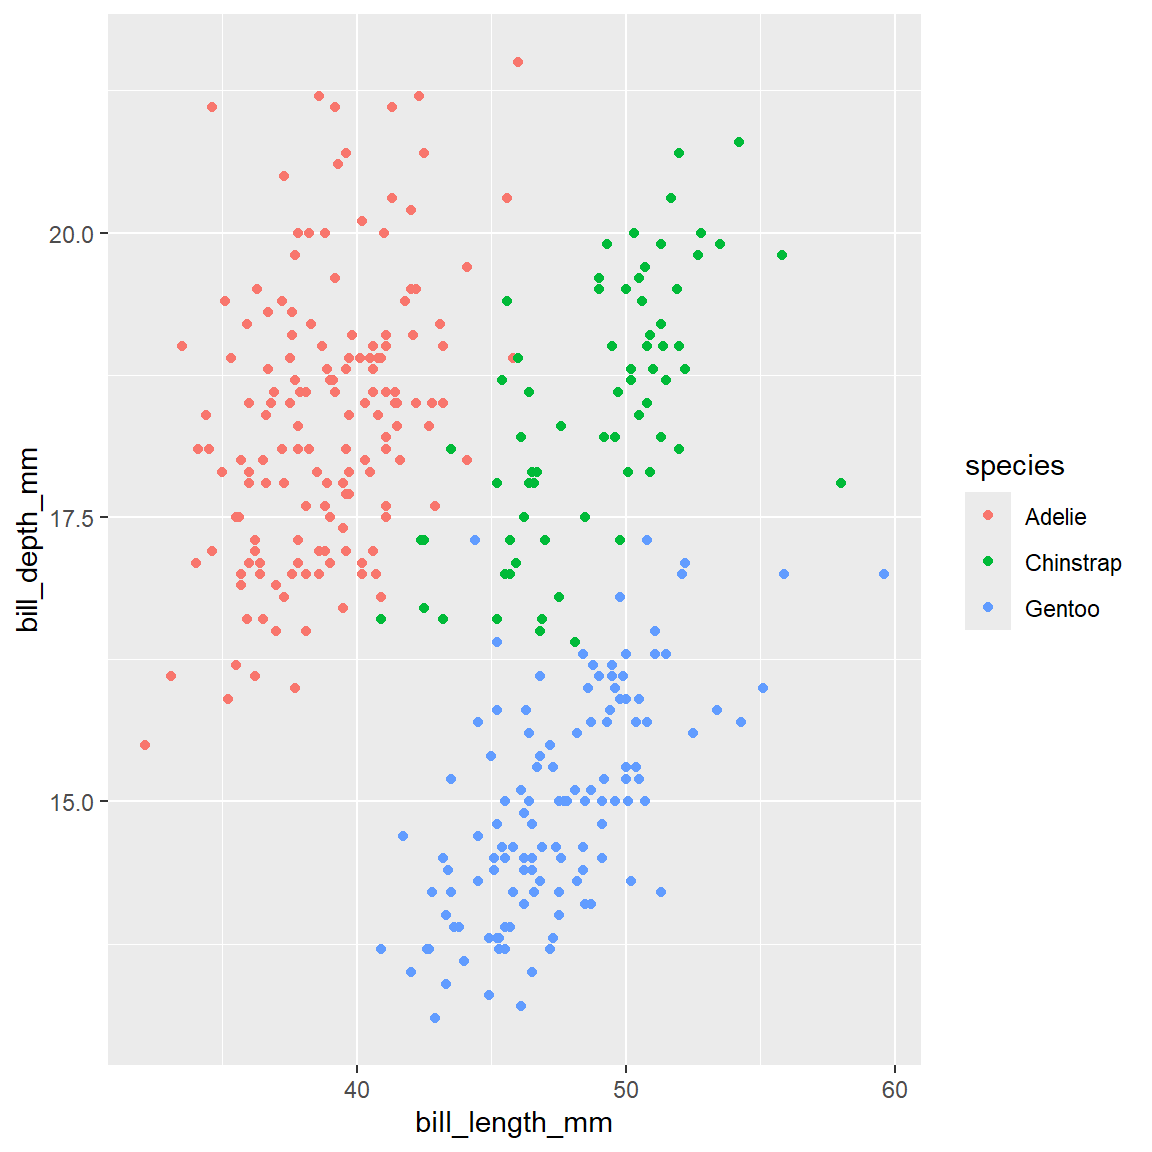
Placeholder boilerplate.
To learn more about Quarto websites visit https://quarto.org/docs/websites.
1 + 1[1] 2Another section
subsection 1
cars summary stats
summary(cars) speed dist
Min. : 4.0 Min. : 2.00
1st Qu.:12.0 1st Qu.: 26.00
Median :15.0 Median : 36.00
Mean :15.4 Mean : 42.98
3rd Qu.:19.0 3rd Qu.: 56.00
Max. :25.0 Max. :120.00 subsection 2
plots
plot(pressure)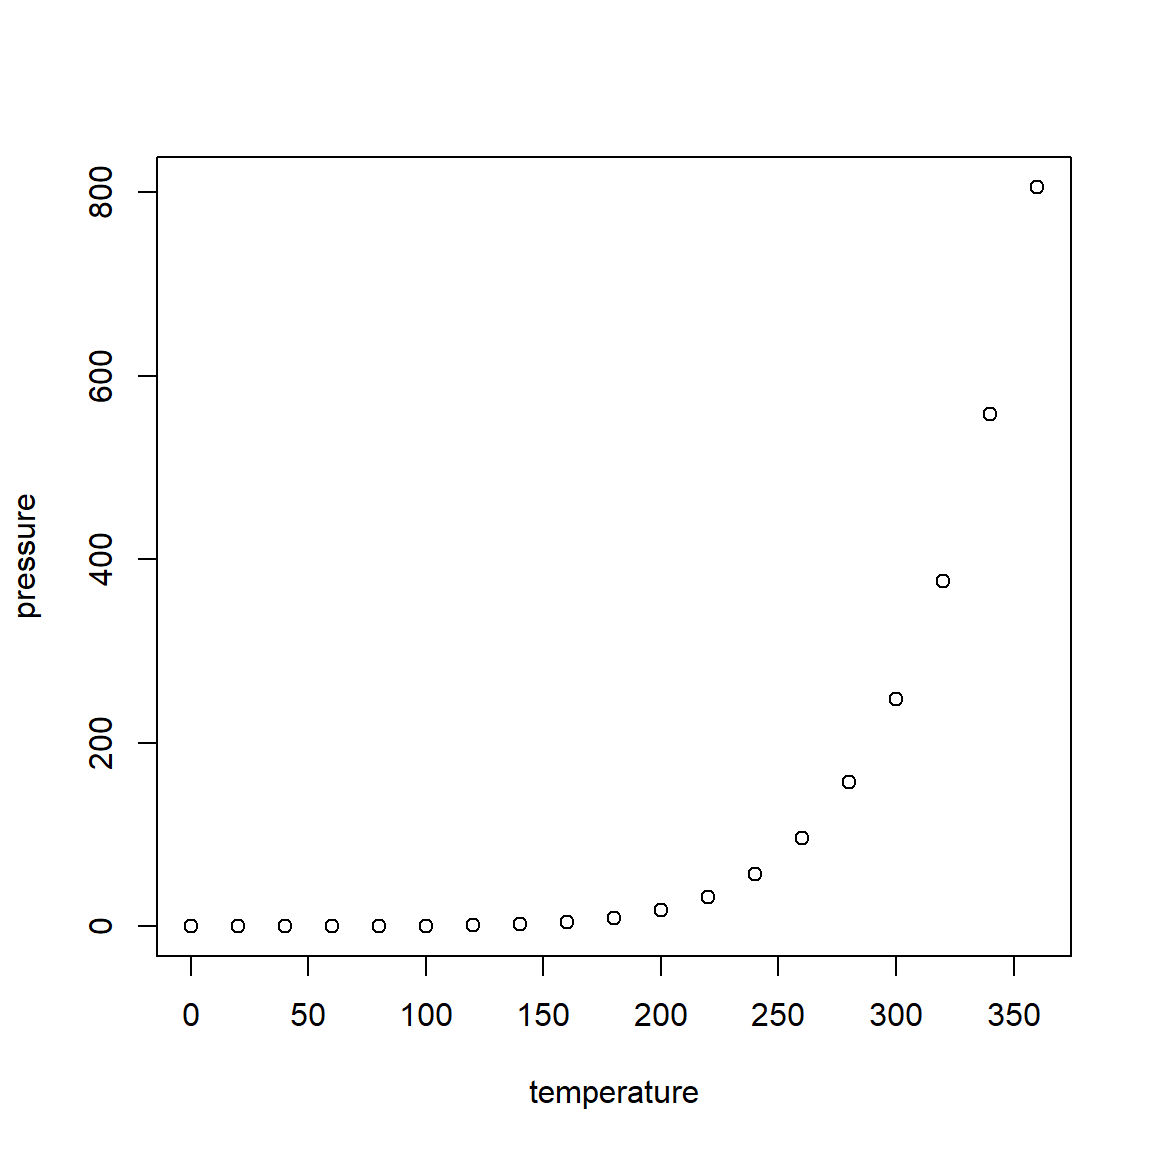
R Code For This Module
add later maybe
References
Horst, Allison, Alison Hill, and Kristen Gorman. 2022. Palmerpenguins: Palmer Archipelago (Antarctica) Penguin Data. https://allisonhorst.github.io/palmerpenguins/.
R Core Team. 2025. R: A Language and Environment for Statistical Computing. Vienna, Austria: R Foundation for Statistical Computing. https://www.R-project.org/.
Wickham, Hadley. 2016. Ggplot2: Elegant Graphics for Data Analysis. Springer-Verlag New York. https://ggplot2.tidyverse.org.
Wickham, Hadley, Winston Chang, Lionel Henry, Thomas Lin Pedersen, Kohske Takahashi, Claus Wilke, Kara Woo, Hiroaki Yutani, Dewey Dunnington, and Teun van den Brand. 2024. Ggplot2: Create Elegant Data Visualisations Using the Grammar of Graphics. https://ggplot2.tidyverse.org.
Wickham, Hadley, Romain François, Lionel Henry, Kirill Müller, and Davis Vaughan. 2023. Dplyr: A Grammar of Data Manipulation. https://dplyr.tidyverse.org.
Other Helpful Resources
other stuff here maybe